The GNP Graph
So here's that GNP graph that I now dub the Lying GNP Screen:
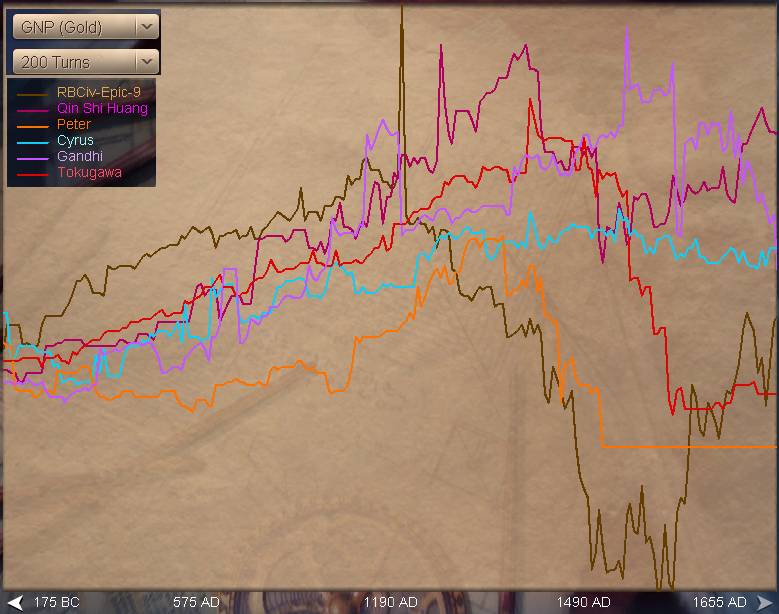
It's not quite actually lying. It does accurately display what it claims to display. But what it displays is meaningless. The common pithy observation that specialists don't figure into the graph is of course correct, but the problems go deeper than that.
GNP is calculated as follows: total commerce in all cities, minus total expenses (as [units + cities + civics] * inflation). That's commerce as in the round yellow coins where sea tiles give you two of them, not cash as in what a merchant produces three of. The GNP demographics screen and graph do NOT count any of the following:
libraries and other beaker multiplier buildings
banks and other cash multiplier buildings
anything that directly adds cash rather than commerce, such as religious shrines and Spiral Minaret
specialist output of all types, including super-specialists and the Representation bonus
loss to the cultural slider (it's still counted even though it has no economic value)
cash from conquest and pillaging
The GNP number is so erroneous because it subtracts two quantities not of the same magnitude. It's unmultiplied raw commerce minus total actual expenses, which is subtracting apples from oranges. It's like subtracting kilometers from miles and claiming you haven't gone anywhere, or subtracting Canadian dollars from American dollars and claiming that you're broke. To truly determine a civ's economic power, you need to compare income and expenses on the same level, which would require the inclusion of shrines, multiplier buildings and specialists.
So despite that gigantic apparent economic black hole, I'm actually researching in the black at 40% at this point. The GNP screen shows my economy as near zero, based on a rough raw commerce total of 500 minus total expenses of 480. But since that raw commerce has an average multiplier of +50% or so, it's actually providing roughly 250 units of economy. Add 50 gold from my collection of religious shrines (three now), and 100 beakers from the Mercantilism-Representation synergy, and you have my economy still producing 400 real units per turn at an apparent GNP of zero.
By the way, the wild swings up and down at the lowest point of the GNP graph reflect the alternating presence and absence of the Great Lighthouse as I conquered and lost it several times in Madras. Also, the final large jump out of negative territory was the completion of the Forbidden Palace to truncate my distance expenses. Because the GNP graph ignores so many economic factors, the following factors that DO get reflected in the GNP graph, all have a greater apparent than real effect:
Financial trait
Trade route commerce, including boosts from harbors
Colossus and Great Lighthouse (and Temple of Artemis in Warlords)
Bureaucracy, Free Speech, and Printing Press
Golden Age
Upkeep cost reduction via courthouses, Organized trait, and Forbidden Palace
Since I had none of those (Great Lighthouse and Forbidden Palace came late), this game created a perfect storm to expose the inadequacies of the GNP graph.
And the saddest part of all this is that the game already calculates the required ingredients for the GNP graph to properly report economy. On the F2 screen, simply taking Research + Taxes - Total Expenses produces an accurate picture of economic production. That might create a bit of an aesthetic downside in that you could see wild swings in the graph depending on where you put the sliders each turn (especially culture), but I think that's a small price to pay to have a much more meaningful economic report.
As the final nail in the coffin for the meaningfulness of the GNP graph, look at the graph from the end of the game.
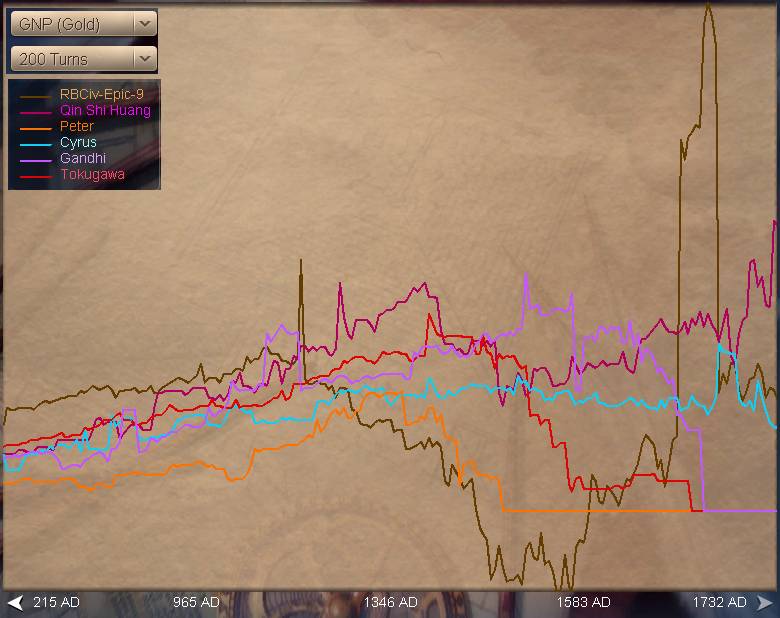
Was I researching five times faster when in Golden Age? No way, but that's what that spike is claiming. In reality, my beaker production was maybe 50% faster.
Now, let it not be said that I am not a man of action. Here is the offending line in CvPlayer.cpp:
updateEconomyHistory(GC.getGameINLINE().getGameTurn(), calculateTotalYield(YIELD_COMMERCE) - calculateInflatedCosts());
And here's the fix:
updateEconomyHistory(GC.getGameINLINE().getGameTurn(), getCommerceRate(COMMERCE_RESEARCH) + getCommerceRate(COMMERCE_GOLD) - calculateInflatedCosts());
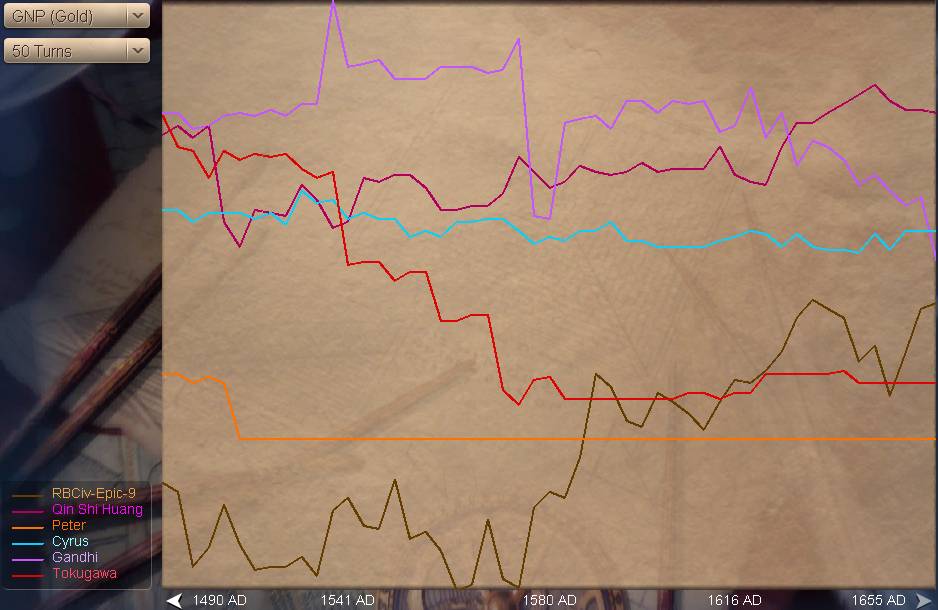
Here's a closer look at that GNP graph of 1655 AD, over the last 50 turns.
Now let's remove the GNP Blur Goggles (like Sirian's Lag Blur Goggles from Diablo 2) and replay the last few turns before that snapshot. This fix does not update historical GNP data in a save file; it only affects newly calculated GNP numbers.
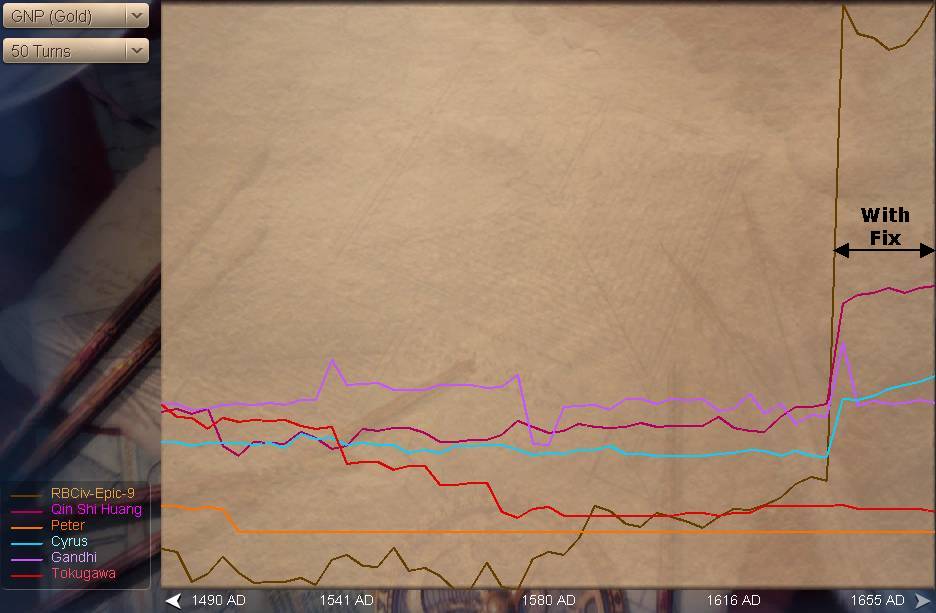
That's the magnitude to which the standard GNP graph can mislead you. Naturally, the overall scale is higher with the fix, because we're now taking into account multiplier buildings and specialists, including the factor of Representation + Mercantilism. But look at that difference in relative scale between me and the AIs. Instead of seeming bankrupt, the true power of my economy is now apparent. I really am producing more research than all the AIs put together, and that's how I'm still keeping a technology lead despite being locked out of the trading loop.
I'm not going to propose this as a mod for RBCiv approval, since it pretty clearly does give the player a new level of information that's not accessible in the unmodded game. However, I shall now go through the proper channels and propose this as a fix for the next patch for Warlords, and for the core game should one ever forthcome.
Index